
EDDMapS Dashboard - My Dashboard
Under Dashboard in My EDDMapS, there are up to three types of Dashboards: My Dashboard, My Verifier Dashboard, and EDDMapS Dashboard. The My Dashboard is a at-a-glance summary of your reviewed records for the year.
📘 Features
Components of the page include
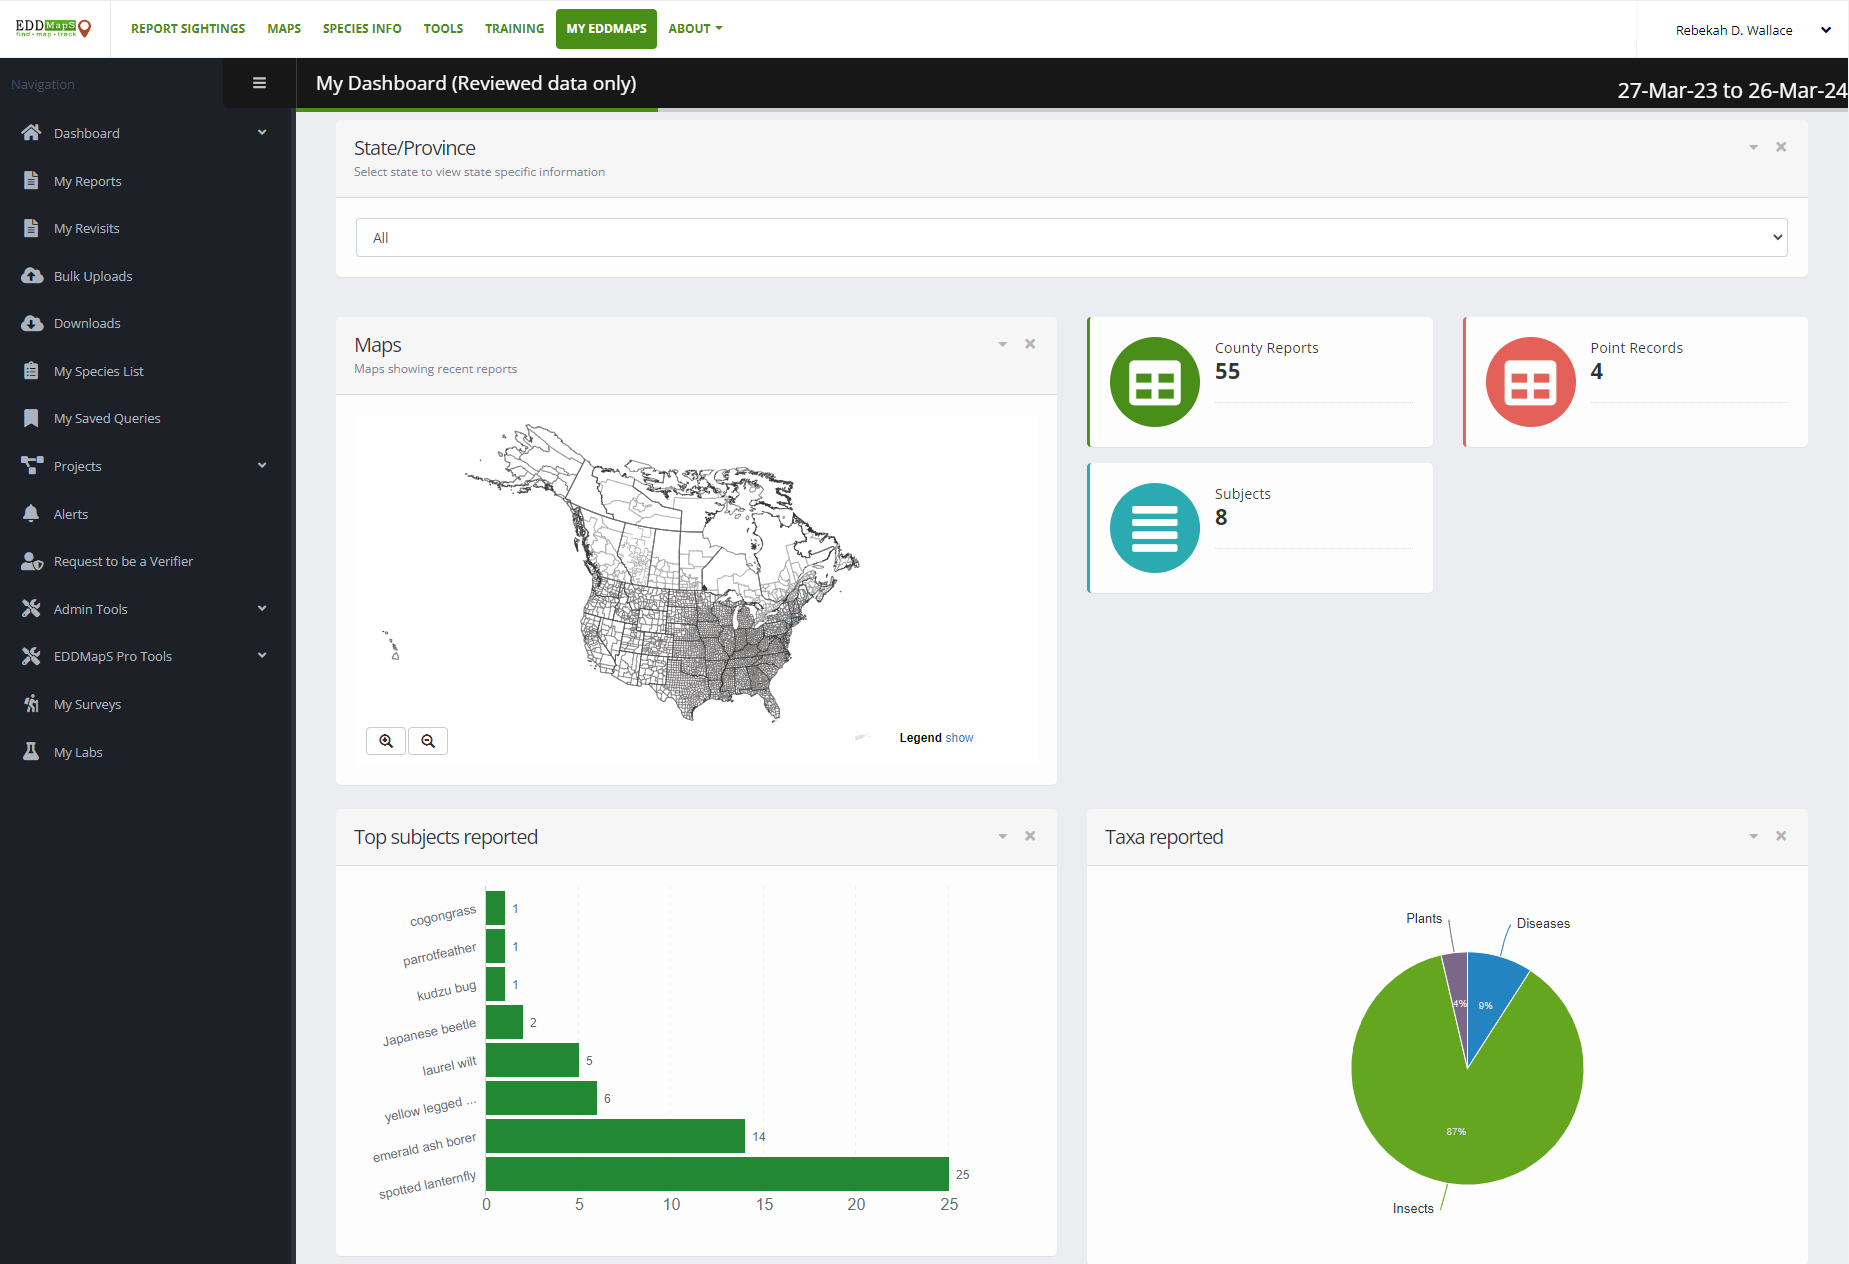
State/province - Allows you to limit the results of the page to one state or province or you can see all your data summarized
Maps - County map of where your records are located
Quick Stats boxes
County Reports - Number of records at a county level
Point Records - Number of records at a point level
Subjects - Number of subjects reported
Top Subjects Reported - Bar graph of subjects you’ve reported with the most number of records
Taxa Reported - Pie chart with percentage of your reports by Division: Plants, Insects, Disease, and Wildlife
My Statistics - A table of your record counts for Overall, This Year, and This Month for:
Number of Reports
Number of Species
Number of States
Number of Counties
My Reports - A table of your recent reports
Statistics are currently not offered for unreviewed records, but you can download all of your records in the Downloads section of My EDDMapS.