
Distribution Maps - Interpretation
🤔 Question
What are the different Distribution Map Types? What do they show?
🌱 Answer
A subject has up to eight different maps on its Distribution Maps page
State Map - Clicking on a state will open a page with all the records for that state
A state or province that is colored green has had that subject or its child taxa reported as present at least once in the EDDMapS database
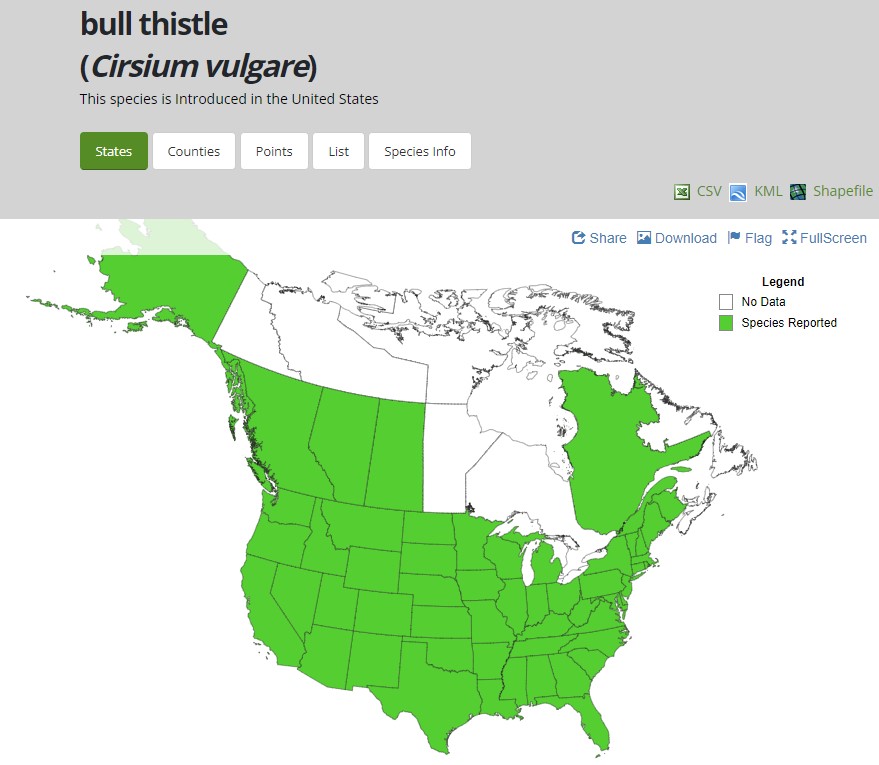
State Distribution Map
County Maps - Clicking on a county will open a page with all the records for that county
Distribution
A green county has had that subject reported as present at least once in the EDDMapS database
Darker green color means the subject exactly has been reported in the county
Lighter green color means child taxa only have been reported in the county
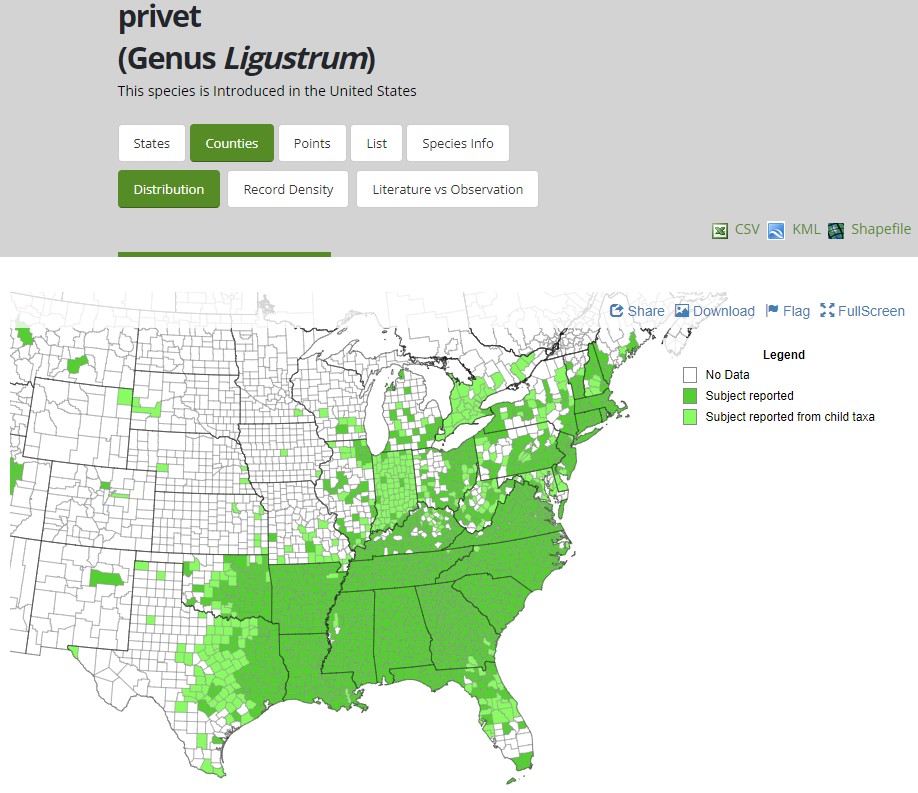
County Distribution Map
Record Density
The number of records for the subject and its child taxa are counted and binned for an at-a-glance view of the subject’s presence in the county
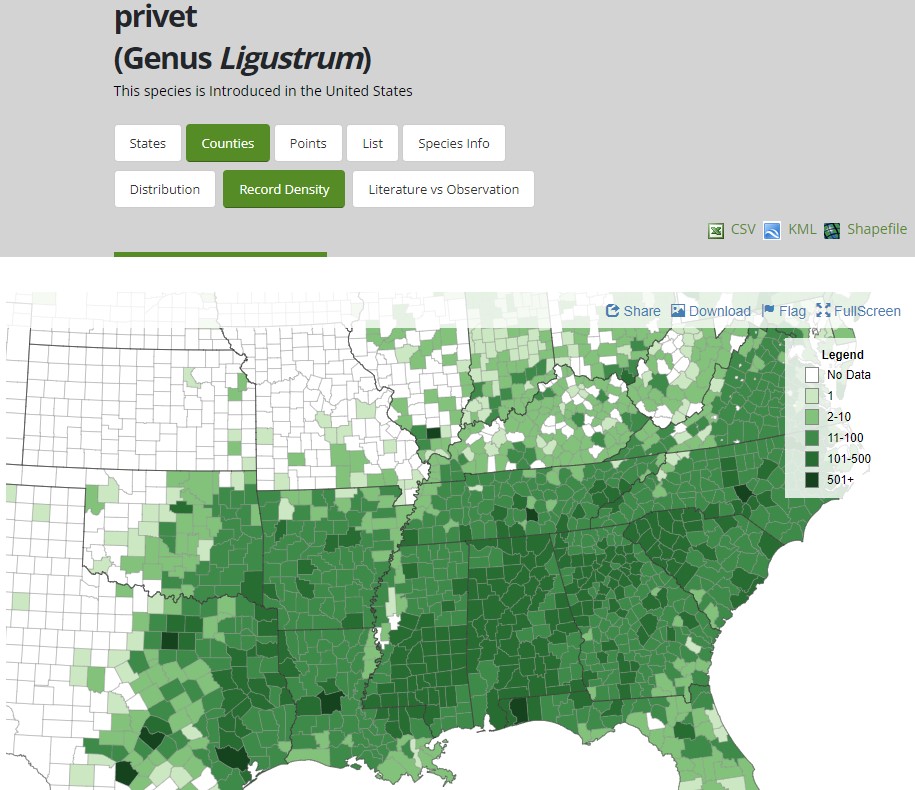
County Record Density Map
Literature vs Observation
Literature Records are sourced from journal articles, herbaria/museums, personal communication, etc.
Observation Records are sourced as individual sightings entered into EDDMapS or from another observation database
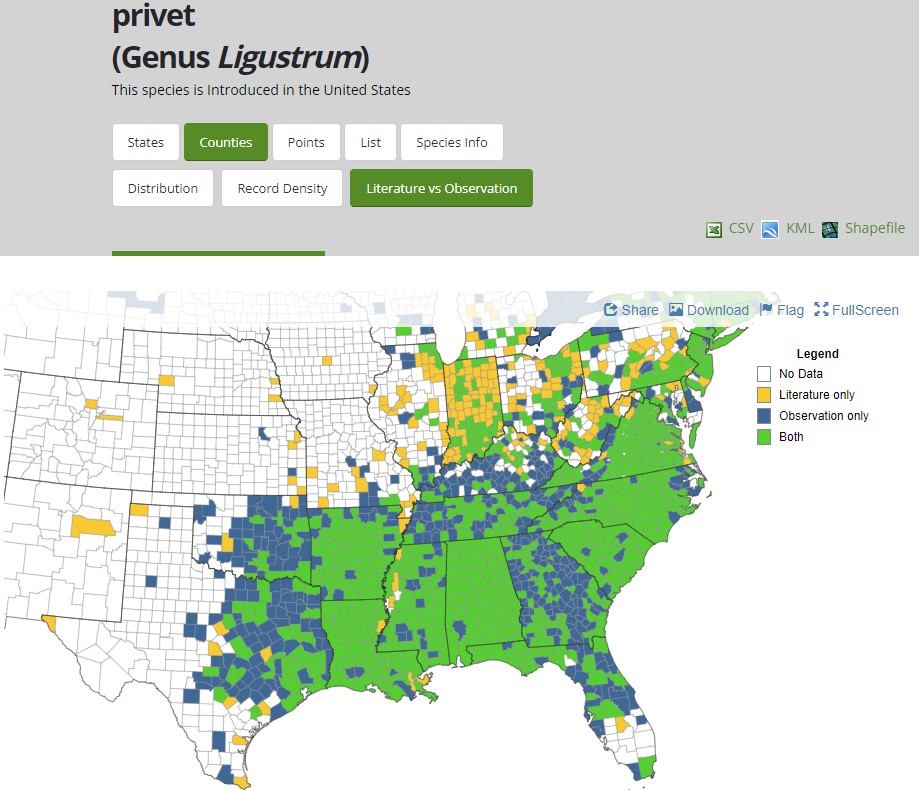
County Literature vs Observation Map
Future Range
This map indicates the agreement of future climate models predicting county-level presence for the selected species by 2041 - 2060 based on currently available evidence. Users can select 1-13 models to show where they agree on the expected presence of the subject in the county
Expansion (orange) - The species is not currently reported there in EDDMapS, but is expected to be there in the future
Stable (light purple) - The species is currently reported there in EDDMapS, and is expected to be there in the future
Retraction (dark purple) - The species is currently reported there in EDDMapS, and is not expected to be there in the future
Unsuitable (white) - The species is not currently reported there in EDDMapS, and is not expected to be there in the future
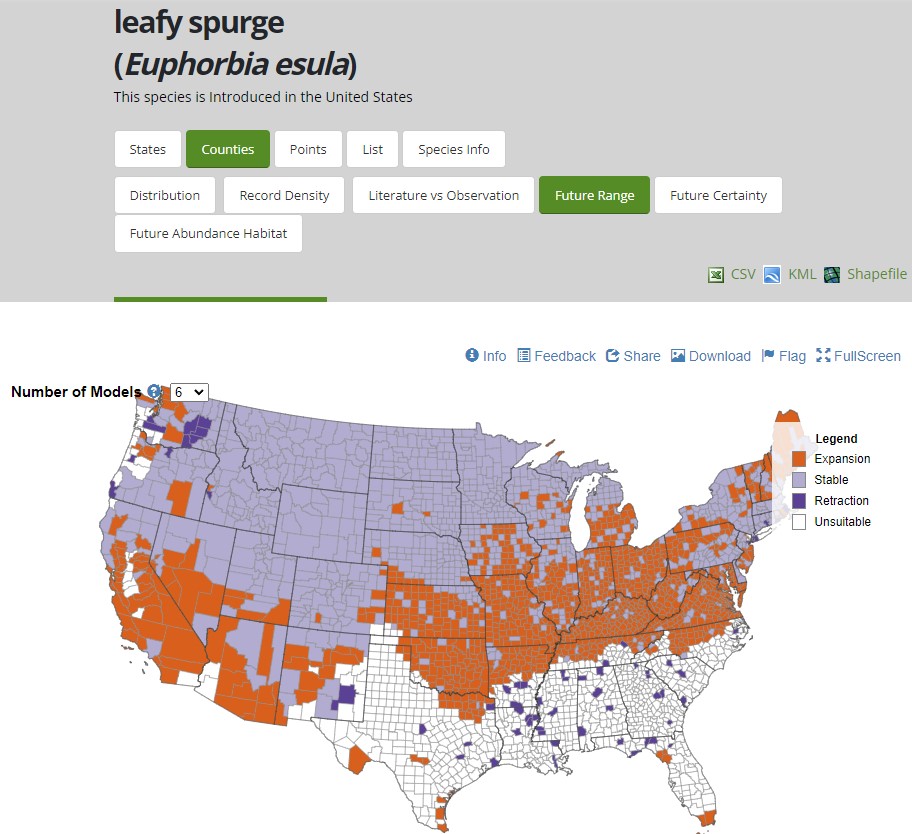
County Future Range Map
Future Certainty
This map indicates the agreement of future climate models predicting county-level presence for the selected species by 2041 - 2060 based on currently available evidence. Higher numbers (darker county colors) indicate higher agreement among models that the county will be suitable for the chosen species by 2041 - 2060.
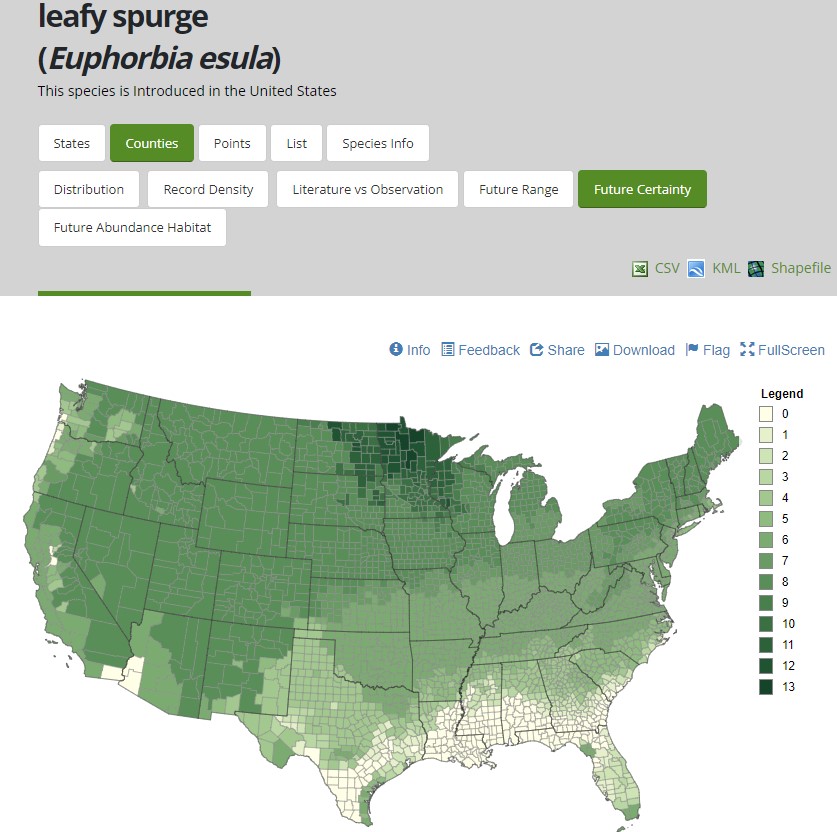
County Future Certainty Map
Future Abundance Habitat
This map indicates the agreement of future abundance-pseudo abundance species distribution models predicting the suitability of counties for populations of the selected species to maintain at least 5% cover ('high abundance') given a +2°C climate change scenario. Higher numbers indicate higher agreement among models that the county will be suitable for abundant populations of the chosen species by 2100 based on currently available evidence.
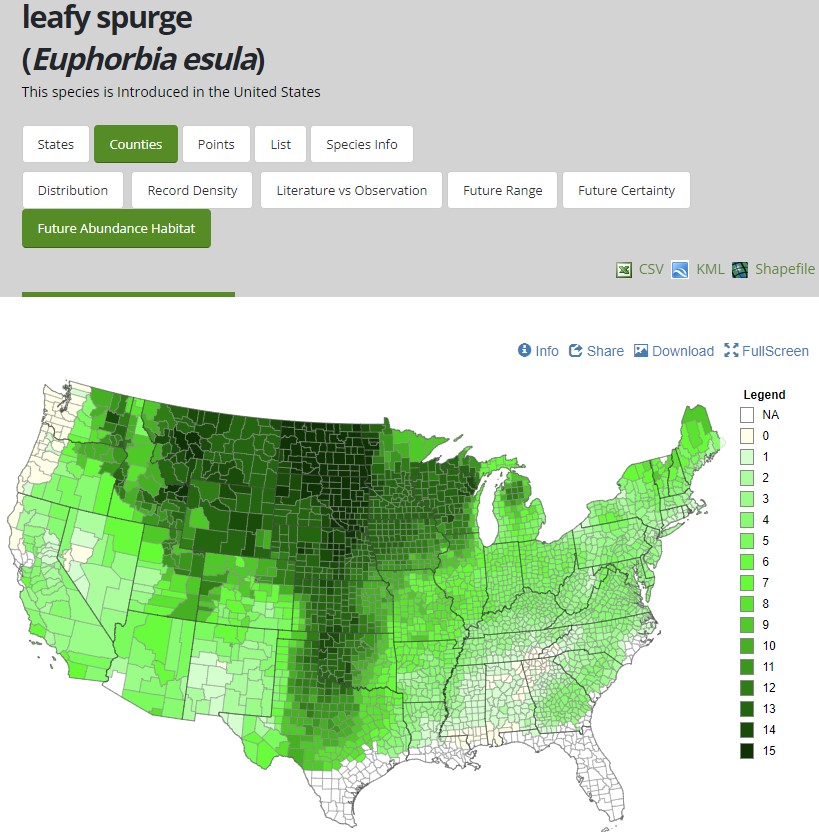
County Future Abundance Habitat Map
Point Maps - Clicking on a point will open that record’s detail page
Records with public coordinates will show up on the point level map. Points are clustered, with the number of points represented displayed on the cluster. Zooming in on the map breaks apart the clusters.
Plant, Insect, and Disease records will have one of four status types
Positive - Subject was found
Treated - Subject was found and some sort of management activity (cut down, trapped, sprayed, biocontrol release, etc.) was conducted
Eradicated - Subject was previously found but has not been found long enough to be considered locally extirpated
Negative - Subject was not found
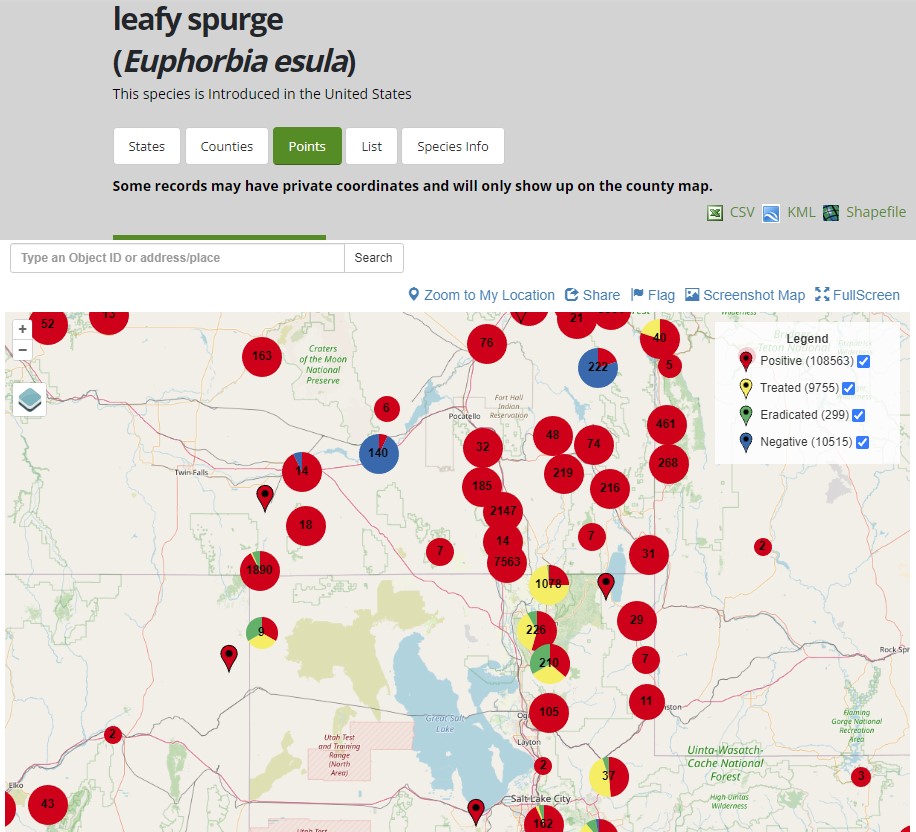
Plant, Insect, Disease Point Map
Wildlife records can have other status types based on the fate of the observed subject
Observation and Other Positive - Subject was found and its fate is unknown
Unknown Managed - Subject was found and a management activity occurred, but the fate of the subject is unknown
Capture - Subject was found and captured
Found Dead - Subject was found dead at time of observation
Not Found - Subject was looked for and not found
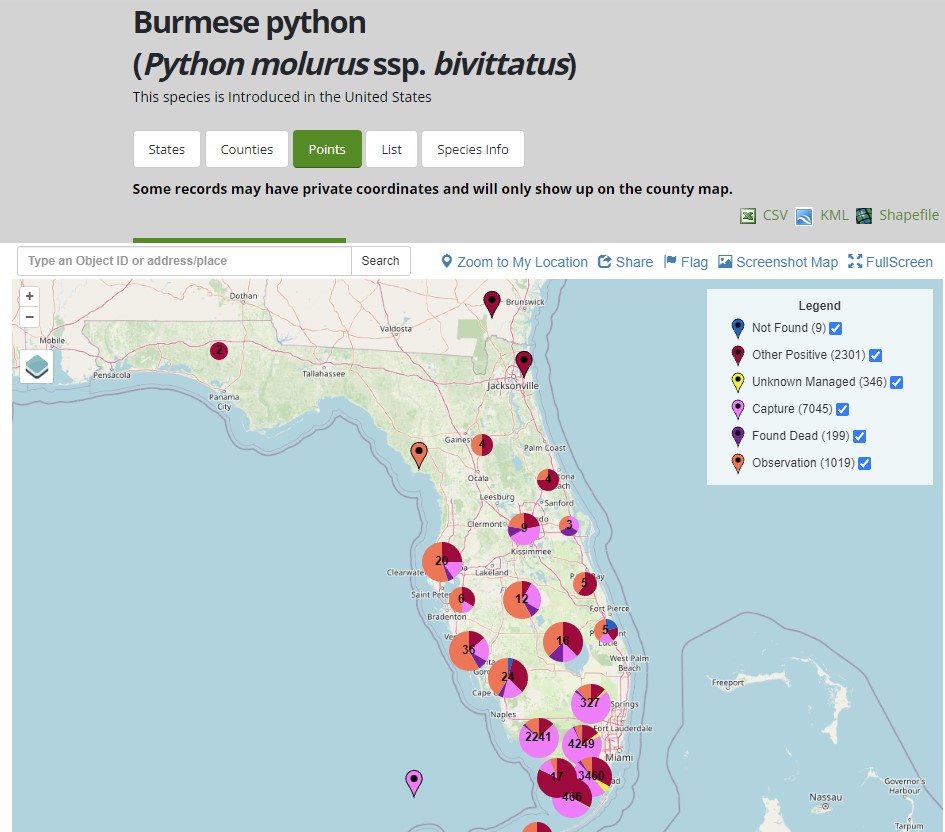
Wildlife Point Map
Not all subjects will have all these maps.